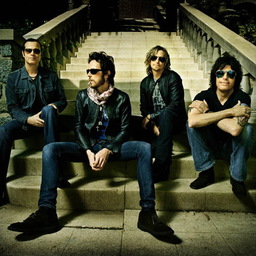
Detailed concert and song statistics on Stone Temple Pilots based on 6 concerts.
Setlists6
Songs performed66
Unique songs performed24
Tags performed0
Covers performed as songs1
Covers performed as tags0
First concertAgriculture Hall, Allentown, PA, USA - Jan 18, 1993
Last concertCopenhell 2019 - Jun 20, 2019
Show Length
Each column represents the number of songs performed in a concert.Number of Encores
Each column represents the number of encores in a concert. Note that concerts without any encores are left out of this graph.Statistics by Month
Month |
Total concerts |
Songs performed |
Tags performed |
Unique songs performed |
Encore songs performed |
|---|---|---|---|---|---|
| 1993 / January | 1 | 0 | 0 | 0 | 0 |
| 2001 / August | 2 | 32 | 0 | 17 | 2 |
| 2010 / June | 2 | 34 | 0 | 17 | 4 |
| 2019 / June | 1 | 0 | 0 | 0 | 0 |
| Totals | 6 | 66 | 0 | 24 | 6 |
Top Songs
Name |
Total |
|---|---|
| Lounge Fly | 4 6.06% |
| Vasoline | 4 6.06% |
| Crackerman | 4 6.06% |
| Big Empty | 4 6.06% |
| Creep | 4 6.06% |
| Trippin' on a Hole in a Paper Heart | 4 6.06% |
| Interstate Love Song | 4 6.06% |
| Plush | 4 6.06% |
| Sex Type Thing | 4 6.06% |
| Sour Girl | 3 4.55% |
| Hollywood Bitch | 2 3.03% |
| Sin | 2 3.03% |
| Days of the Week | 2 3.03% |
| Coma | 2 3.03% |
| Too Cool Queenie | 2 3.03% |
| Down | 2 3.03% |
| Wicked Garden | 2 3.03% |
| Between the Lines | 2 3.03% |
| Hickory Dichotomy | 2 3.03% |
| Bagman | 2 3.03% |
| Huckleberry Crumble | 2 3.03% |
| Tumble in the Rough | 2 3.03% |
| Dead and Bloated | 2 3.03% |
Top Covers
Name |
Total |
|---|---|
| Dancing Days by Led Zeppelin | 1 100.00% |
