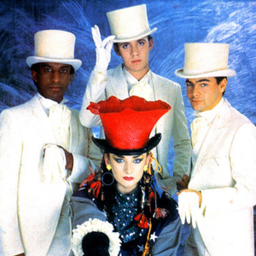
Detailed concert and song statistics on Culture Club based on 2 concerts.
Setlists2
Songs performed26
Unique songs performed14
Tags performed0
Covers performed as songs3
Covers performed as tags0
Show Length
Each column represents the number of songs performed in a concert.Number of Encores
Each column represents the number of encores in a concert. Note that concerts without any encores are left out of this graph.Statistics by Year
Year |
Total concerts |
Songs performed |
Tags performed |
Unique songs performed |
Encore songs performed |
|---|---|---|---|---|---|
| 2018 | 2 | 26 | 0 | 14 | 4 |
| Totals | 2 | 26 | 0 | 14 | 4 |
Statistics by Month
Month |
Total concerts |
Songs performed |
Tags performed |
Unique songs performed |
Encore songs performed |
|---|---|---|---|---|---|
| 2018 / June | 2 | 26 | 0 | 14 | 4 |
| Totals | 2 | 26 | 0 | 14 | 4 |
Top Songs
Name |
Total |
|---|---|
| Different Man | 2 7.69% |
| Runaway Train | 2 7.69% |
| It's a Miracle | 2 7.69% |
| I'll Tumble 4 Ya | 2 7.69% |
| Human Zoo | 2 7.69% |
| Time (Clock of the Heart) | 2 7.69% |
| Let Somebody Love You | 2 7.69% |
| Do You Really Want to Hurt Me | 2 7.69% |
| Church of the Poison Mind | 2 7.69% |
| Miss Me Blind | 2 7.69% |
| Karma Chameleon | 2 7.69% |
| Life | 1 3.85% |
Top Covers
Name |
Total |
|---|---|
| Addicted to Love by Robert Palmer | 2 66.67% |
| Let's Dance by David Bowie | 1 33.33% |
