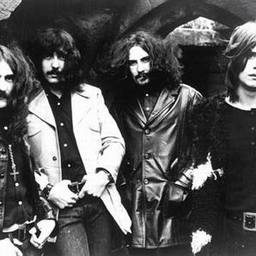
Detailed concert and song statistics on Black Sabbath based on 3 concerts.
Setlists3
Songs performed48
Unique songs performed24
Tags performed1
Covers performed as songs0
Covers performed as tags0
First concertGrant Park, Chicago, IL, USA - Aug 3, 2012
Last concertLanxess Arena, Köln, Germany - Jan 17, 2017
Show Length
Each column represents the number of songs performed in a concert.Number of Tags (1)
Each column represents the number of tags performed in a concert. Note that concerts without tags are left out of this graph.Number of Encores
Each column represents the number of encores in a concert. Note that concerts without any encores are left out of this graph.Statistics by Month
Month |
Total concerts |
Songs performed |
Tags performed |
Unique songs performed |
Encore songs performed |
|---|---|---|---|---|---|
| 2012 / August | 1 | 16 | 1 | 16 | 1 |
| 2013 / August | 1 | 17 | 0 | 17 | 1 |
| 2017 / January | 1 | 15 | 0 | 15 | 1 |
| Totals | 3 | 48 | 1 | 24 | 3 |
Top Songs
Name |
Total |
|---|---|
| Black Sabbath | 3 6.25% |
| Behind the Wall of Sleep | 3 6.25% |
| N.I.B. | 3 6.25% |
| Into the Void | 3 6.25% |
| Snowblind | 3 6.25% |
| War Pigs | 3 6.25% |
| Iron Man | 3 6.25% |
| Fairies Wear Boots | 3 6.25% |
| Dirty Women | 3 6.25% |
| Children of the Grave | 3 6.25% |
| Paranoid | 3 6.25% |
| Under the Sun / Every Day Comes and Goes | 2 4.17% |
| Rat Salad | 2 4.17% |
| The Wizard | 1 2.08% |
| Under the Sun | 1 2.08% |
| Electric Funeral | 1 2.08% |
| Sweet Leaf | 1 2.08% |
| Symptom of the Universe | 1 2.08% |
| Age of Reason | 1 2.08% |
| End of the Beginning | 1 2.08% |
| Methademic | 1 2.08% |
| God is Dead | 1 2.08% |
| After Forever | 1 2.08% |
| Hand of Doom | 1 2.08% |
Top Tags
Name |
Total |
|---|---|
| Sabbath Bloody Sabbath | 1 100.00% |
