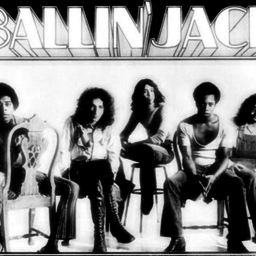
Detailed concert and song statistics on Ballin' Jack based on 2 concerts.
Setlists2
Songs performed16
Unique songs performed13
Tags performed0
Covers performed as songs0
Covers performed as tags0
Show Length
Each column represents the number of songs performed in a concert.Number of Encores
Each column represents the number of encores in a concert. Note that concerts without any encores are left out of this graph.Statistics by Year
Year |
Total concerts |
Songs performed |
Tags performed |
Unique songs performed |
Encore songs performed |
|---|---|---|---|---|---|
| 1973 | 2 | 16 | 0 | 13 | 1 |
| Totals | 2 | 16 | 0 | 13 | 1 |
Statistics by Month
Month |
Total concerts |
Songs performed |
Tags performed |
Unique songs performed |
Encore songs performed |
|---|---|---|---|---|---|
| 1973 / February | 1 | 8 | 0 | 8 | 1 |
| 1973 / December | 1 | 8 | 0 | 8 | 0 |
| Totals | 2 | 16 | 0 | 13 | 1 |
Top Songs
Name |
Total |
|---|---|
| Big Dealer | 2 12.50% |
| Special Pride | 2 12.50% |
| Hold On | 2 12.50% |
| So Do I | 1 6.25% |
| Come Up Front | 1 6.25% |
| This Song | 1 6.25% |
| Carry Me Back | 1 6.25% |
| Share This Feeling | 1 6.25% |
| Runaway People | 1 6.25% |
| Tycoon Baffoon | 1 6.25% |
| If You Don't Like My Music | 1 6.25% |
| Peace And Harmony | 1 6.25% |
| Two Years | 1 6.25% |
